First technical indicator I used is the Moving Average Converge Divergence (MACD). According to Investopedia, MACD is a trend-following momentum indicator that shows the relationship between two exponential moving averages (EMA) of prices. EMA is simply the weighted average closing price of the last few trading days that gives more weight/emphasis to the latest data. MACD is calculated by subtracting the 26-day EMA from the 12-day EMA. Then we use a 9-day EMA of the MACD, called the "signal line" as a trigger for buy and sell signals. In the area highlighted by blue circle chart below, the MACD line crosses and rises above the signal line, meaning it is a bullish sign. On 28th February 2015 (red circle), the MACD is still above the signal line and thus Pestech still in bullish mode.
The two technical indicators indicate that Pestech is still in bullish mode and thus likely to have some more upside. However, the cautious me decided to exit while the market is still bullish and the Pestech volume is still high. So I sold my 1000 units of Pestech @ RM4.96, earning 22% Holding Period Return (HPR). The two transactions in 2015 so far:
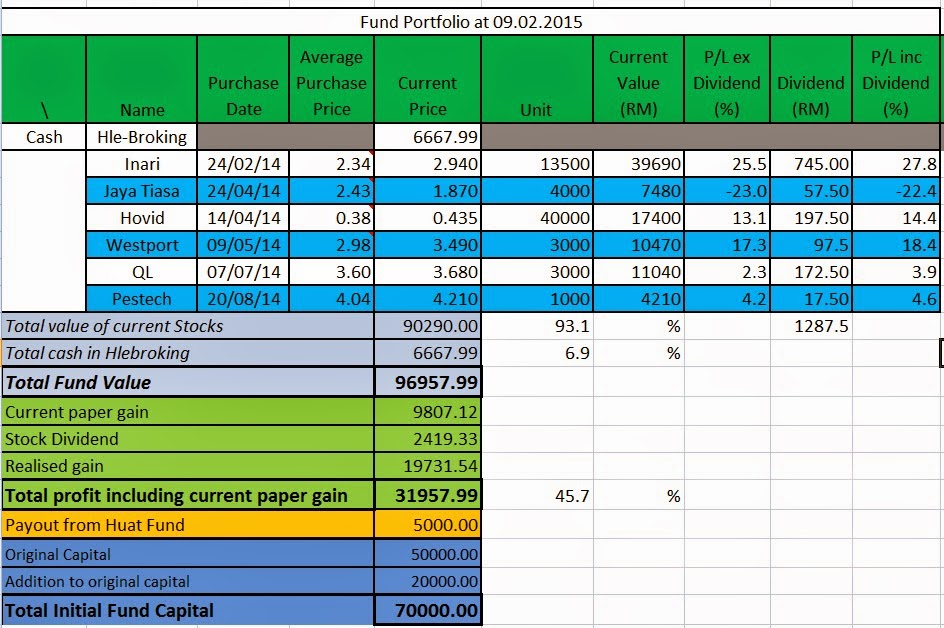
After this transaction, Huat Fund looks like this:


